
Hello folks. I’ve been using Linux for gaming on and off for over a year but I’m getting frustrated. I’m not completely new to Linux outside of gaming, but I’m no master or expert obviously. The two games I play the most are having frustrating issues and I can’t figure out what is happening. I’m hoping someone has some ideas for additional troubleshooting or, if I’m lucky, ideas for a solution. My searching has only found people complaining of more normal, consistent issues like crashing or low FPS vs Windows or just low FPS from the start. Edit: This includes Proton DB. I even have my own experience on there.
Also, I don’t really have anything beyond Steam and a number of games via Steam installed. This computer is for gaming and that’s it.
Does anyone have an recommendations? After months of this I’m frankly thinking of getting a 9070 XT or something to see if that resolves the issue but that’s a last resort.
Thanks!
TLDR: Forcing Proton 9.0-4 is the only solution I’ve found.
Hardware
Hardware
MB: ASUS B650M-PLUS WF
Processors: 16 × AMD Ryzen 7 9800X3D 8-Core Processor
CPU Cooler: NOCTUA NH-D15S
Case: LIANLI A3-MATX
Additional Cooling: be quiet! Silent Wings 4 120mm (x2, Top & Rear Exhaust)
PSU: LIANLI SP850
Storage (Linux): SANDISK 2TB WD BLACK SN850X
Storage (Windows): ADATA 1TB SX8200PNP
Memory: G.SKILL 64G 2X D5 6000 C30 FX B (“EXPO I” Enabled - Running at 6000 as per MB)
GPU: NVIDIA GeForce RTX 4080 SUPER (ZOTAC RTX4080S AMP)
Space Marine - Problem 1
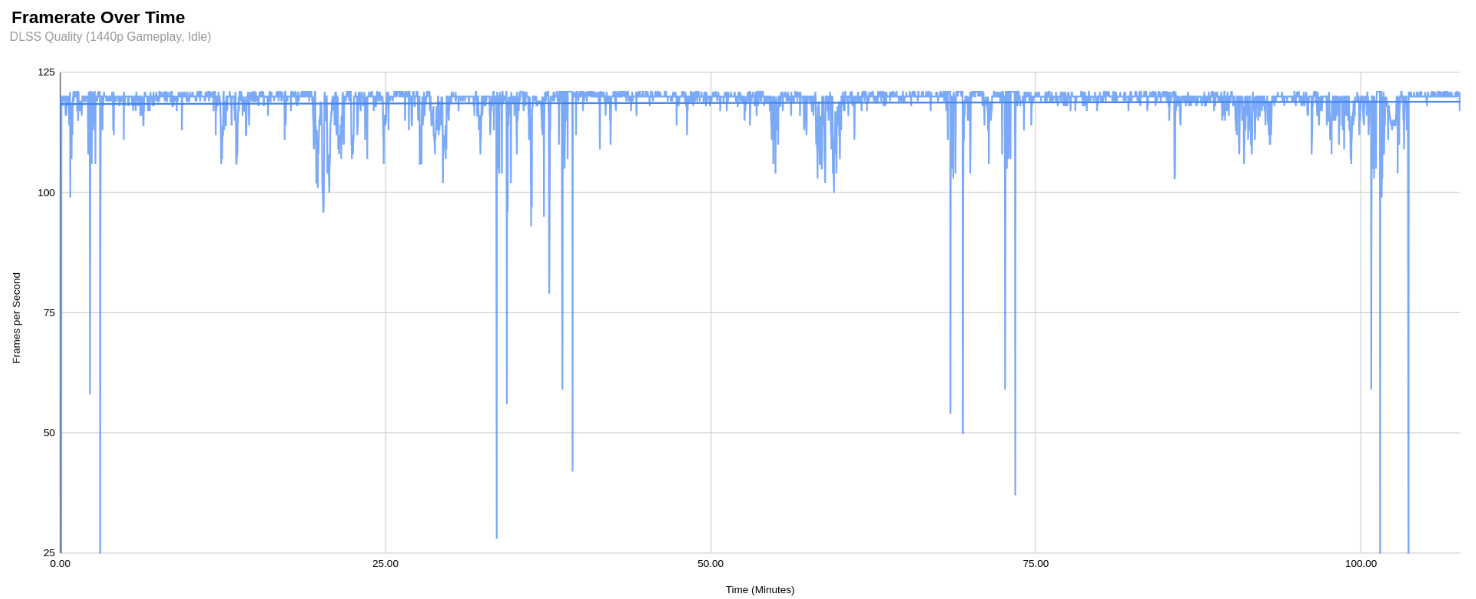
I’m typically running at Ultra 1440p Borderless (No Ray Tracing or Framegen) DLSS “Quality” (1.5x Lower Res with Upscaling) with an FPS cap at 120Hz. I get steady performance loss over time, as if the system is throttling but logging shows temperature (and GPU/CPU load) decreasing over time. I’ve tried Native (1440p), a number of DLSS settings, Borderless and Full Screen, lowered detail levels, etc. Nothing I’ve done changes the behavior - GPU load always falls over time and performance tanks until I can’t take it anymore and restart the game.
Ex.
DLSS “Quality” starts at ~120 FPS, 96% GPU Load
At 60 minutes, ~65 FPS, ~55% GPU Load
At 2+ hours, ~42 FPS and ~38% GPU Load, GPU Core Clock even drops 200+MHz
On Windows 10 I’ve gone 2+ hours at a steady 120 FPS with the same settings. I originally started with Bazzite but out of frustration I figured I’d try openSUSE Tumbleweed, hoping it was some bizarre Bazzite quirk. After some brief testing, I experience the same issue. Normally I use whatever version of Proton Steam suggests, but I’ve tried manually selecting Proton Experimental and 10.2 beta with no change in behavior. I’ve always used NVIDIA drivers rather than nouveau, but I honestly don’t know how to try older NVIDIA drivers.
The earlier pages are from August while using Bazzite (BZ). The last few are on Tumbleweed (TW). Usually, I literally start the game, load the “hub”, and let it idle until it kicked me for inactivity 60 minutes later. One log has some actual gameplay + idle to document see how bad it gets after 2+ hours. More recent logs are from different version of Proton, as described above, left idle until I came back and could definitively see a downward trend.
Data & Graphs
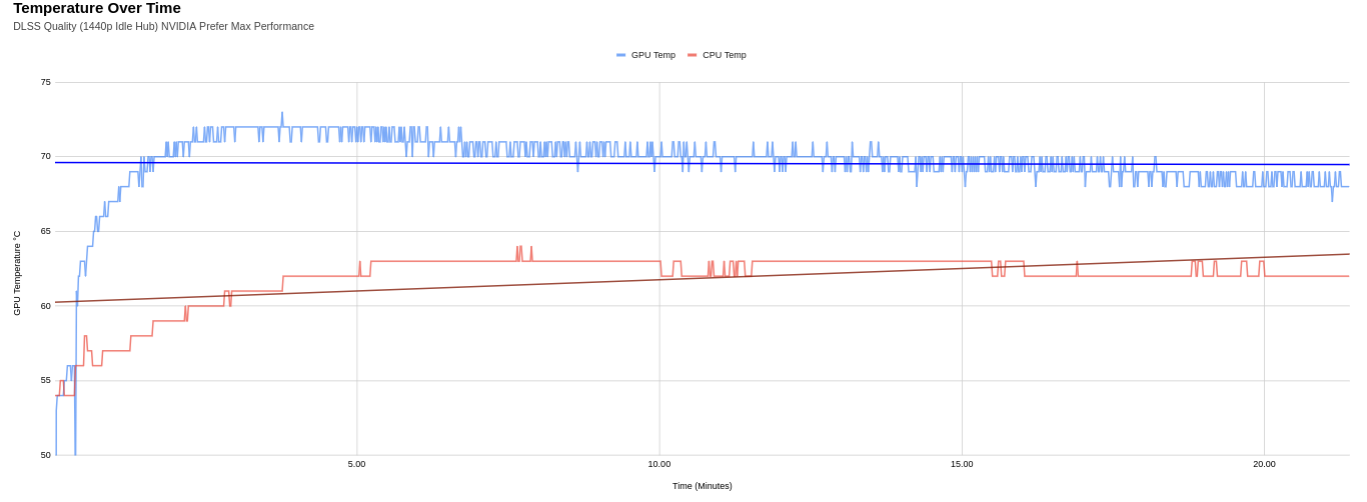
A few of my graphs. Click the link above for more. FPS drops over time, ~1 per minute. GPU/CPU load drops over time. Temperature is stable then drops when GPU/CPU loads start getting lower. VRAM/RAM is stable. GPU/CPU frequency is stable. SSD Temps don’t seem to exceed 55 C. No reason I can find for it to throttle.
Native (Idle):


DLSS Quality (Idle):


DLSS Quality (Gameplay, then Idle):


Note - the behavior isn’t new in August, I’d just started playing multiplayer more with friends in June. I wanted to focus on just using my Linux partition exclusively and being that annoying friend who talks about how great gaming on Linux is. I assumed it was an issue assets not getting unloaded or something and figured it would be fixed in a patch. By August I’d gotten tired of the weird behavior to start really investigating it, installed MangoHud, etc. After my complaining, my friends are decidedly LESS interested in gaming on Linux. I’m only fueled by my hatred of Windows 11 and spite.
Satisfactory - Problem 2
I haven’t tested openSUSE yet so this is more of a Bonus issue. I’ll update if continue to experience it on this distro. It isn’t as detrimental but its still frustrating because I don’t know how to even document it. At inconsistent intervals, maybe 45-90 minutes, the game hangs for an extended period of time. Alt-tab away and everything is fine with the rest of the system, desktop interface is 100% responsive. If I alt-tab back to the game, it remains hung. Eventually, ~20-40 seconds after it freezes, everything is back to normal until the next random interval when it happens again. Time also doesn’t pass in game - if I was mid air, I resume mid air.
Now what is absolutely fascinating to me about this problem is that it is invisible in my mangohud logs. It’s like time stands still until the game resumes. Zero dips, spikes, elapsed time gaps, or anything I’d expect just before it starts or after it recovers. I haven’t figured out a way to include the system time in the log to get records of how long it lasts. If you know how to get that in the log please let me know.
Edits
Graphs below for a low-quality run (DLSS Performance & Quality Preset Low) on Tumbleweed. GPU/CPU load starts lower, degrades more or less the same.
DLSS Performance, Low Quality Preset (Idle, Gameplay, Idle):


I’ve tested my SSD temperature via watch -n 1 nvme smart-log /dev/nvme0 - I’ve not see it above 125° F (<55° C). I have 600GB free on / and 1.2TB free on /home, and I have swap large enough for sleep. I did not run it during gaming yet, but swapon shows:
NAME           TYPE       SIZE USED PRIO
/dev/nvme0n1p3 partition 66.5G   0B   -2
I’ve run nvidia-smi -q -d PERFORMANCE (while GPU load was down to ~70%) by switching to a cmdline and running it plus recording every second nvidia-smi -q -l 1 -f smi.log -d PERFORMANCE with the game running in the foreground. More or less the same. Sometimes if I’ve not had the focus on the game window for a while Idle will be Active.
> nvidia-smi -q -d PERFORMANCE

==============NVSMI LOG==============

Timestamp                                 : Tue Sep 23 07:06:07 2025
Driver Version                            : 580.82.07
CUDA Version                              : 13.0

Attached GPUs                             : 1
GPU 00000000:01:00.0
    Performance State                     : P0
    Clocks Event Reasons
        Idle                              : Not Active
        Applications Clocks Setting       : Not Active
        SW Power Cap                      : Not Active
        HW Slowdown                       : Not Active
            HW Thermal Slowdown           : Not Active
            HW Power Brake Slowdown       : Not Active
        Sync Boost                        : Not Active
        SW Thermal Slowdown               : Not Active
        Display Clock Setting             : Not Active
    Clocks Event Reasons Counters
        SW Power Capping                  : 1160456 us
        Sync Boost                        : 0 us
        SW Thermal Slowdown               : 0 us
        HW Thermal Slowdown               : 0 us
        HW Power Braking                  : 0 us
    Sparse Operation Mode                 : N/A
Spent almost 2 hours playing SM2 on Windows 10. FPS stayed ~120 pretty consistently with typical occasional dips, often during loading screens and such. Graphs below.
Windows 10 - Gameplay then brief idle:

Left the game idle for 20 minutes after installing NVIDIA X Server Settings and setting Prefer Maximum Performance as the preferred mode. Same degrading performance. Using alt-tab to switch to desktop doesn’t restore or reset performance, nor does running vulkaninfo.

It was suggested I test for stability with OCCT. I did find that with hour long combined Extreme/Steady CPU+RAM/GPU tests would inconsistently register errors with CPU cores. Looking into that, I saw that overclocking might be the cause so I turned off the ASUS motherboard’s “AI Tweaker” setting of “Expo I” (use timings from EXPO memory modules) and set it to automatic. A few hour long Extreme/Steady CPU+RAM/GPU on both Windows and Linux no longer generated errors. Unfortunately, leaving EXPO off did not seem to impact/resolve my issue. The same behavior persisted for another two sessions of gaming without EXPO.
Solution
Incredibly stupid. I didn’t realize that, whether it was something I personally set a while ago and that is tied to my account (because this is my third distro) or whether it is Steam’s default, the “Default Compatibility Tool” was set to Proton Experimental. I’d assumed Steam would use the latest stable release, and so I’d manually set SM2 to use Experimental, Hotfix, the 10.2beta, or unchecked the option to force a specific version… I’d never forced 9.0-4. When I discovered there was a Proton logging option, I found that the log showed me using Experimental so I looked around and discovered my default was experimental. I set the default to 9.0-4 and the issue no longer occurred. I went back, set the default to experimental and set SM2 to specifically use Proton 9.0-4. I’ll confirm whether or not this resolves the issue.
Confirmed. It seems to be an issue with Proton 10+? As long as I force Proton 9.0-4, the issue does not occur.
Don’t have an answer but I applaud your diligence in trying to find an answer in this issue
I’m in IT and I was a computer Tech. I enjoy building gaming PCs and I know a good bit but this is really frustrating me. As I said, I’m currently driven by spite and hatred of Windows, especially 11.
Could it be that you’re running out of VRAM? The NVIDIA driver is unable to swap VRAM to RAM, so even just a tiny bit of leakiness of the game will make performance eventually deteriorate when VRAM fills up.
I believe that I’ve ruled that out. See the blue line in the
fourthfifth graph in each set. When idling VRAM is steady at ~5.5GB, but performance degrades. I’ve also checked VRAM availability outside of mangohud while the game is running and my total VRAM usage/availability aligns with the game’s VRAM usage reported by mangohud.
Fwiw, I’ve had some very similar problems with GPU performance on my very weird setup. I’m going to share what I know and if that helps you diagnose, great. If anyone has suggestions, please reply.
My setup
- same symptoms on Bazzite, CachyOS, Ubuntu
- various kernels going back to 6.11 and up to 6.16
- Intel 265k
- z890 mb
- 192 gb ram @5400
- GPU (3080ti + 7900xtx + Radeon Pro VII + Radeon Pro VII + Intel Integrated graphics)
- usually Wayland
- usually using 7900xtx as primary GPU/ output
- on Ubuntu, tried a ton of driver combos, mesa, nouveau (sp?), nvidia proprietary 550-580.
- like op, I do not see any thermal throttling, nor are any components near those kinds of temps
My problem areas are very similar:
-
Performance (fps) degradation during gaming. Games slow down while temps decrease. VRAM and Ram are nowhere near full utilization. Hard drive is near room temp. CPU load is minimal. I have a wattage tracker at the wall and can see wattage drop. Steam games with multiple versions of Proton/ Proton GE
-
Vulkan-based compute workloads. Hence the weird GPU setup. Same deal. Start a workload at 100% throughput and watch it drop to 30% over the span of a few minutes. This is with artificial benchmarks where I can control workload variables
What ive found
-
LACT has helped. Setting a card to “Highest Clocks” has a meaningful difference
-
on some games, simply switching to the desktop and back resets performance. Works on Deep Rock
-
simply running vulkaninfo rests performance to 100%. I often resort to: watch -n .5 vulkaninfo
-
x11 behaves better but its not a complete fix
-
on x11 nvidia control panel “Prefer Maximum Performance” makes a big difference
-
I’m still figuring out how to get GPU p-states to lock to maximum. I’ve tried locking clocks but that’s not doing it
-
OS power saving set to lowest power tanks performance, but between balanced and high there’s no impact to this problem
-
disabling anything related to PCIe power saving in bios hasn’t made a difference
Tried as few things from your suggestion:
- Running vulkaninfo or switching to the desktop have no performance “reset” type effect.
- Prefer Maximum Performance didn’t seem to make a difference.
I might try to run a few other games to see if anything else triggers it. I haven’t noticed any other games with the FPS drop over time but I don’t play many other demanding games.
While running the games with issues, open a terminal and try:
nvidia-smi -q -d PERFORMANCEI ran the game for a while, idling. GPU load is down to 70%. I ran the process. Also tried looping nvidia-smi in the background with the game as the focus for a while.
> nvidia-smi -q -l 1 -f smi.log -d PERFORMANCEAll of the records look like this:
> nvidia-smi -q -d PERFORMANCE ==============NVSMI LOG============== Timestamp : Tue Sep 23 07:06:07 2025 Driver Version : 580.82.07 CUDA Version : 13.0 Attached GPUs : 1 GPU 00000000:01:00.0 Performance State : P0 Clocks Event Reasons Idle : Not Active Applications Clocks Setting : Not Active SW Power Cap : Not Active HW Slowdown : Not Active HW Thermal Slowdown : Not Active HW Power Brake Slowdown : Not Active Sync Boost : Not Active SW Thermal Slowdown : Not Active Display Clock Setting : Not Active Clocks Event Reasons Counters SW Power Capping : 1160456 us Sync Boost : 0 us SW Thermal Slowdown : 0 us HW Thermal Slowdown : 0 us HW Power Braking : 0 us Sparse Operation Mode : N/AThis command should tell you if its throttling at all, it can be caused by power issues or In my case it was a thermal slowdown to prevent components getting damaged.
I see your edits and, dang, I was hoping we could move the needle. Another idea:
Try running a game through game scope. You would add this line to the launch options in Steam’s per-game settings. Adjust to your resolution and desired refresh:
gamescope -W 1920 -H 1080 -r 60 -- %command%https://github.com/ValveSoftware/gamescope
You can use it to troubleshoot all kinds of things.
Thanks. I just tried adjusting a few gamescope settings but the utilization still goes down over time. Seems to give me a virtual sandboxed display? I’m honestly not sure how I can use it to troubleshoot more than I can by adjusting the settings in game. Any recommendations on options that might reveal more information?
Thanks again.
You could use it to force resolution, HDR, vrr, refresh rate. It helped you isolate this not being a compositor issue.
I had a similar time stop in RL but shorter. Imo its bad memory or cpu or drivers. If works in windows prly not hardware. I think mine went sway after cpu swap.
Cooler, storage and OS?
Cooler, storage and OS?
Added more detail to the Hardware Spoiler. NOCTUA NH-D15S. Temps don’t seem to be an issue - as I mentioned in the post, usage/load goes down over time, eventually so much that so do my temps.
As mentioned in the post, OS was Bazzite, trying Tumbleweed now on a whim to see if it was a Bazzite issue. It’s not, still happans.
Saw that, seems to be at the ~30 min mark What’s your storage situation?
FWIW I have a R9 7900 and RX9070 with zero issues running bazzite. My SSDd would get hot in the high 60s and would start to show similar symptoms. Limiting to gen3 speeds and adding more fans was my solution.
You should look up Mission Control flatpak to get a better idea of the current state of things; great if you have a second screen.
Mission Control? Do you mean Mission Center?
Yes, sorry that’s the one
Sorry, wasn’t sure which SSD I had the Windows Partition on and needed to look up commands to check. Looks like I’m using the newer Sandisk WD Black SN850X for Linux.
One more thing to rule out hardware issues
Use OCCT and run a benchmark and stability test
It seems I get stuck once a benchmark is finished. I downloaded what appears to be an appimage from their website. Ex.
00:00:00 - Info - Benchmark schedule started at 2025-09-22 23:46:03
00:00:00 - Info - CPU - Benchmark initializing
00:00:00 - Info - CPU - Benchmark started
00:00:10 - Info - CPU - 1 threads, SSE : 108.47
00:00:10 - Info - CPU - Benchmark stopped
00:00:10 - Info - CPU - Benchmark initializing
00:00:10 - Info - CPU - Benchmark started
00:00:20 - Info - CPU - 16 threads, SSE : 954.19
00:00:20 - Info - CPU - Benchmark stopped
00:00:21 - Info - CPU - Benchmark initializing
00:00:21 - Info - CPU - Benchmark started
00:00:31 - Info - CPU - 1 threads, AVX : 229.73
00:00:31 - Info - CPU - Benchmark stopped
00:00:31 - Info - CPU - Benchmark initializing
00:00:31 - Info - CPU - Benchmark started
00:00:42 - Info - CPU - 16 threads, AVX : 1 935.24
00:00:42 - Info - CPU - Benchmark stopped
00:00:42 - Info - Uploading the results to Ocbase
00:00:42 - Info - Schedule Completed
~~~~~
00:00:00 - Info - Benchmark schedule started at 2025-09-22 23:52:29
00:00:00 - Info - Memory - Benchmark initializing
00:00:00 - Info - Memory - Benchmark started
00:00:10 - Info - Memory - Read : 2 034.06
00:00:10 - Info - Memory - Benchmark stopped
00:00:10 - Info - Memory - Benchmark initializing
00:00:10 - Info - Memory - Benchmark started
00:00:20 - Info - Memory - Write : 780.88
00:00:20 - Info - Memory - Benchmark stopped
00:00:21 - Info - Memory - Benchmark initializing
00:00:21 - Info - Memory - Benchmark started
00:00:31 - Info - Memory - Combined : 1 317.76
00:00:31 - Info - Memory - Benchmark stopped
00:00:31 - Info - Uploading the results to Ocbase
00:00:31 - Info - Schedule Completed
~~~~~
00:00:00 - Info - Benchmark schedule started at 2025-09-22 23:56:51
00:00:00 - Info - Storage benchmark - Benchmark initializing
00:00:00 - Info - Storage benchmark - Benchmark started
00:00:21 - Info - Storage benchmark - Sequential Read : 7 360.58 MB/s
00:00:21 - Info - Storage benchmark - Benchmark stopped
00:00:22 - Info - Storage benchmark - Benchmark initializing
00:00:22 - Info - Storage benchmark - Benchmark started
00:00:43 - Info - Storage benchmark - Sequential Write : 6 246.57 MB/s
00:00:43 - Info - Storage benchmark - Benchmark stopped
00:00:44 - Info - Storage benchmark - Benchmark initializing
00:00:44 - Info - Storage benchmark - Benchmark started
00:01:06 - Info - Storage benchmark - Random Read : 1 651.07 MB/s
00:01:06 - Info - Storage benchmark - Benchmark stopped
00:01:07 - Info - Storage benchmark - Benchmark initializing
00:01:07 - Info - Storage benchmark - Benchmark started
00:01:28 - Info - Storage benchmark - Random Write : 1 870.32 MB/s
00:01:28 - Info - Storage benchmark - Benchmark stopped
00:01:29 - Info - Schedule Completed
00:01:29 - Info - Uploading the results to Ocbase
After the CPU, Memory, and Storage benchmarks it consistently just… sits. No errors, nothing of note. I have a big stop button and the green animation continues at the top left. However nothing else happens after this point if I wait/leave it for a while. The “Stop” button is unresponsive. I have to close and reopen. Am I doing something wrong? I tried Memory and CPU multiple times, same behavior. Tried the “Test” version 15, same.
I did have some success with the latency test. Only tried it once though.
00:00:00 - Info - Benchmark schedule started at 2025-09-22 23:54:02
00:00:00 - Info - Latency / bandwidth - Benchmark initializing
00:00:00 - Info - Latency / bandwidth - Pausing monitoring to ensure accurate readings through the benchmark
00:00:00 - Info - Latency / bandwidth - Benchmark started
00:00:03 - Info - Latency / bandwidth - L1 Latency : 2.89 ns
00:00:10 - Info - Latency / bandwidth - L1 Read Bandwidth : 2 557.30 GiB/s
00:00:17 - Info - Latency / bandwidth - L1 Write Bandwidth : 2 550.08 GiB/s
00:00:20 - Info - Latency / bandwidth - L2 Latency : 6.72 ns
00:00:27 - Info - Latency / bandwidth - L2 Read Bandwidth : 1 785.33 GiB/s
00:00:34 - Info - Latency / bandwidth - L2 Write Bandwidth : 1 745.18 GiB/s
00:00:40 - Info - Latency / bandwidth - L3 Latency : 51.07 ns
00:00:46 - Info - Latency / bandwidth - L3 Read Bandwidth : 593.72 GiB/s
00:00:53 - Info - Latency / bandwidth - L3 Write Bandwidth : 356.05 GiB/s
00:01:01 - Info - Latency / bandwidth - Memory Latency : 73.82 ns
00:01:13 - Info - Latency / bandwidth - Memory Read Bandwidth : 82.86 GiB/s
00:01:24 - Info - Latency / bandwidth - Memory Write Bandwidth : 30.44 GiB/s
00:01:24 - Info - Latency / bandwidth - Benchmark stopped
00:01:24 - Info - Latency / bandwidth - Resuming Monitoring
00:01:24 - Info - Uploading the results to Ocbase
00:01:24 - Info - Schedule Completed
00:01:24 - Info - Upload successful
Running the stability now and going to sleep.
No errors is good Try the blend test with CPU and GPU rendering set to 100% for an hour. For me my SSDs sit under 59 and 55 respectively, 40 at idle
With my motherboard’s “Expo I” setting (uses timing from RAM rather than system default), I do get occasional core errors in Windows and Linux on hour combined runs, and sometimes just with the CPU/Memory hour run, though its inconsistent - sometimes just one or a few errors, another time a slew of them. I figured my “Expo I” setting might have something to do with it so I turned it off.
With it off I ran it for a full hour, once in Windows and once in Linux, and now receive no errors. Played for about 2 hours tonight on Linux and the issue still occurs without using the “Expo I” setting.
I’ll play a bit and keep an eye on my SSD temp and I’ll run OCCT later. Thanks!
Yeah, it’s not a throttling issue.
My next suspicion would be (CPU) swapping to disk, which tends to get worse over time like that. Check with
swaponjust in case, but I’d be shocked if that’s the issue with memory usage so low.
I know you probably loathe hearing this and you absolutely don’t have to go this route…
But a good way to troubleshoot would be to dual-boot windows and try it there; see if it’s a pure game/engine issue, or something to do with your software platform. Otherwise you could spend forever looking for proton/driver/de issues and such when you’re simply looking at some quirk of the game engine.
I actually originally started SM2 on Windows 10 last fall playing single player, and I did play a few nights this summer on Windows 10 while troubleshooting to test. I was unable to reproduce the issue on Windows - played 2+ hours without it happening.
I think I did it a few weeks ago actually, when my discord client wouldn’t connect and I figured I’d test it again to see.
If I have time with all my other testing I’ll give it another shot tonight or tomorrow night.
Got about ~110 minutes on Windows 10 tonight. FPS was stable. Graphs posted.
Hmmm, yeah, that + similar problems on multiple linux distros points to some baseline linux issue… which is not so specific, unfortunately. Could be a common config you make across distos, a common driver issue, a common proton issue… or a game engine quirk.
First, always check ProtonDB and see if other people have the same issues or tweaks to fix.
Second, get some system metrics, and check logs to see if anything obvious is showing.
First, always check ProtonDB and see if other people have the same issues or tweaks to fix.
I’ve edited my post for clarity. I’ve checked for similar reports and posted my own experience on Proton DB. I described what I found in the beginning of my post - nothing specifying decreased performance over time, at least the last time I checked.
Second, get some system metrics, and check logs to see if anything obvious is showing.
Did… you look at the graphs? There are a lot of them. I’ll see if I can post screenshots here - I’ve not tried that before.
Edit: Are there some system logs I can check for more information?
I don’t click Google Drive links.
What I CAN tell you is that if it’s time-based, it’s either heat or memory. There is no third thing.
Now, it could be a memory leak in the game, which would be widespread and others would see the same. That’s something that has to be addressed by developers.
Do you have temp info, or just CPU and Memory? If the latter, and you can see a continual increase in memory until it has issues, that’s a memory leak more than likely. If others are reporting the same, you’re not going to find anything to help you here.
Best advice I can give you is to lower settings and play for as long as you can until the devs fix that.
I don’t click Google Drive links.
Fair enough. I’ve since posted images of several graphs.I initially assumed thermal throttling or resource exhaustion. I just can’t find any evidence to support either cause.
Heat: No temperatures I can measure are anywhere near the limits that cause throttling. GPU, CPU, SSD are all relatively cool. I can’t measure VRAM temp (because NVIDIA) but it’s also important to note zero issues in Windows.
Resources: Neither RAM or VRAM appear to be exhausted. My idle tests show 5.5/16GB VRAM and 16/64GB System RAM used. Other system-wide monitors confirm that VRAM/RAM and GPU/CPU usage (overall) matches the games usage so nothing external seems to be hogging the resources. I have plenty of space left in my partitions so I’m not running out of disk space.
Does it still happen if you lower the settings a notch though?
I updated my post with graphs from a DLSS Performance + Low Graphics Preset run. Didn’t seem to have any impact, beyond lower initial GPU Load (low 70’s vs high 90s).
Definitely on Bazzite. I tried lowering the DLSS render scale to performance and also dropping the graphics quality preset.
I’ll double check that it still happens on Tumbleweed though and log it later today.
Good information. Can you post a few things. Kernel version, mesa version and nvidia driver version.
Check If youre on x11 or Wayland. Bazzite and OpenSuse are both Wayland by default but check. If on Wayland try on x11 or vice versa.
Check you aren’t on power saving mode in your desktop and I think theres a way to do it on the card as well.
Check GE Proton latest version sometime these kind of issues are fixed.
Check if the issue also happens on a linux native game to rule out proton being the issue.
Based on these the last issue is the nvidia driver which you’ll probably want to submit a bug report on the nvidia fourm to get some more expert help diagnosing the problem. https://forums.developer.nvidia.com/t/if-you-have-a-problem-please-read-this-first/27131
I have/had the same problem in cs2 (native; so no proton involved) and AMD RX5600XT.
My performance degradation is seemingly fixed for now after my last system update (and switch to latest xanmod kernel (which is at 6.12 I think))
Since I’ve been checking, my kernel has been 6.14 to 6.16+, whatever Bazzite and now openSUSE Tumbleweed defaults to. Currently - Kernel Version: 6.16.7-1-default (64-bit). I’m not familiar with the xanmod kernel or running custom kernels at all.
I just checked and realised I’m on 6.16 as well. I don’t think the xanmod kernel will solve your problem, it could be worth a try though, if you are desperate.
Have you checked proton db to see what other gamers are saying about these two games?
Yes. I can’t find anything beyond my own post complaining of my specific issue. I’ve also added more hardware detail and images of a few of my graphs since my link seemed to be ignored.